Read our research on the luggage industry, the top brands, and the key statistics for carry-on and checked luggage.
Table of Contents
Luggage Statistics [2024]: Consumer, Product & Growth Data
![Luggage Statistics [2024]: Consumer, Product & Growth Data](https://travelfreak.com/wp-content/uploads/2023/06/best-wheeled-luggage-1200x800.jpg)
The luggage industry is changing. The same big brands have dominated the business for decades, but now new startups are making an impact in the luggage market and redefining what it means to be a successful travel brand.
Our team has spent years building up expertise in the luggage market. We’ve worked directly with many of the top brands in the industry and have tested dozens of suitcases during our own extensive travels. We built this report based on our years of industry experience and in-depth research into the luggage market, brands, and design trends.
While the travel industry, and luggage specifically, took a hit during the COVID-19 pandemic, travel is officially back and on the rise. As more people are traveling around the globe, the demand for luggage is also rising. Plus, as trendy startup brands like Away and Monos are gaining traction, the perception of luggage is changing from a boring essential to something with style and personality.
I will guide you through a full analysis of our in-depth research and highlight the key luggage statistics from our research.
Key Luggage Statistics
- In 2020, luggage retail sales in the US dropped 59% due to pandemic travel bans.
- The global luggage market is expected to exceed pre-pandemic growth in 2024.
- Samsonite is still by far the largest luggage brand, with over $2.9 billion in revenue in 2022.
- Despite Samsonite’s market domination, Away Travel has almost double the internet search interest.
- The average carry-on suitcase weighs 7.6 lbs and has 40.3 L of volume.
- The average checked suitcase weighs 10.4 lbs and has 91.2 L of volume.
- The July Carry-On Light was the lightest suitcase in our analysis, weighing just 3.9 lbs.
- At $1430, the RIMOWA Original Cabin was the most expensive suitcase in our analysis.
- The countries with the highest internet search interest in luggage are wealthy island nations like Singapore, the UK, and New Zealand.
- Inside the US, coastal states have much higher search interest in luggage, and Hawaii is the leader by far.
Luggage Market Statistics
More people are traveling than ever before, and, despite COVID-19 setbacks, the travel industry as a whole has been growing rapidly over the past decade. Luggage is no exception to that.
In the wake of COVID-19 and the emergence of a host of startup luggage brands, the market is continually changing. Here are the key statistics for understanding the luggage market.
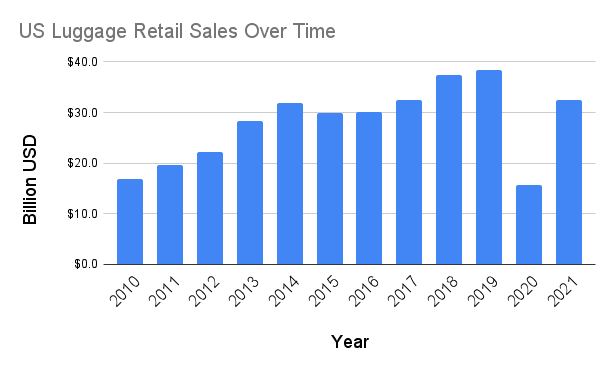
US Luggage Retail Sales Over Time
From 2010 to 2019, US luggage retail sales increased by nearly 130% according to Statista. This growth was driven by more people traveling combined with innovation in the industry and more focused marketing online and in social media.
The chart and table below show the total retail sales for luggage in the US from 2010 to 2021.
|
US Luggage Retail Sales |
|
| Year |
Billion USD |
|
2010 |
$16.8 |
| 2011 |
$19.7 |
|
2012 |
$22.2 |
|
2013 |
$28.2 |
|
2014 |
$32.0 |
| 2015 |
$30.0 |
| 2016 |
$30.2 |
|
2017 |
$32.5 |
| 2018 |
$37.5 |
|
2019 |
$38.4 |
|
2020 |
$15.6 |
|
2021 |
$32.5 |
From 2019 to 2020, COVID travel bans caused a 59% drop in US luggage retail sales. By 2021, luggage sales had returned to 85% of pre-pandemic levels in the United States.
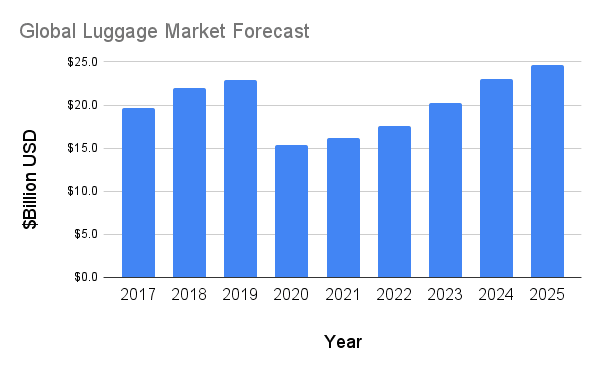
Global Luggage Market Size Forecast
In 2022, the global luggage market was valued at $17.6 Billion, according to Statista.
The chart below shows the past and forecasted growth of the luggage market worldwide, from 2017 to 2025.
|
Global Luggage Market Size Forecast |
|
|
Year |
Billion USD |
|
2017 |
$19.7 |
| 2018 |
$22.0 |
|
2019 |
$22.9 |
|
2020 |
$15.3 |
| 2021 |
$16.2 |
|
2022 |
$17.6 |
| 2023 |
$20.2 |
|
2024 |
$23.1 |
| 2025 |
$24.6 |
While the global luggage market was still far below pre-pandemic levels in 2022, it is expected to surpass those levels by the end of 2024. From 2019 to 2029, researchers at Mordor Intelligence predict a 7.2% compound annual growth rate in the luggage industry.
More people are traveling around the world, and we can only expect that trend to continue. That’s good news for both established luggage brands and newer startups in the business.
In the years and months leading up to COVID-19, several new brands emerged in the luggage and travel gear space.
While the pandemic was a challenging time for new travel brands, those that did manage to survive (Beis, Monos, July, and others) will likely experience significant growth in the coming years as the luggage industry as a whole continues to grow rapidly.
Luggage Search Interest by Month
While the seasonal trends in luggage sales and search interest are not as striking as for backpacks (which are most in demand at “back-to-school” season), there definitely are yearly-repeating patterns.
The table below shows US search interest in the term “luggage” by month from January 2021 to December 2023 according to Google Trends.
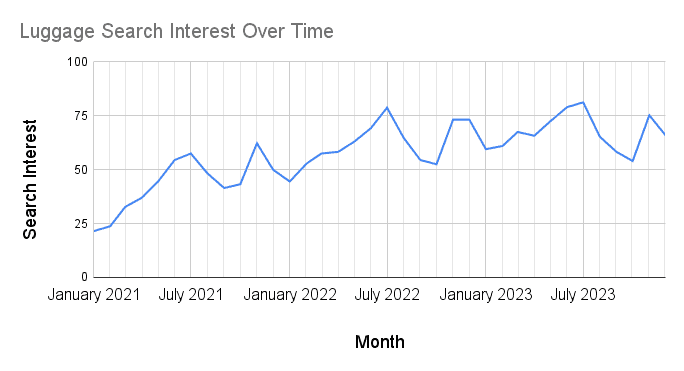
The pattern in the chart above shows that every year there are two spikes in search interest for luggage.
The first is a gradual ramp-up through the spring that peaks in July. Summer is the season that universally sees the most travel, and this trend reflects that. As school summer vacations start, people are shopping for luggage to gear up for trips.
The second spike is in the holiday season, especially Black Friday Weekend. This is the most profitable time of year for many consumer goods industries, so it’s no surprise that people are more interested in luggage during this time.
Luggage Brand Statistics
For many decades, luggage was a fairly stable, not particularly exciting product range. A few enormous brands dominated the business, and people knew what to expect from these brands and their products. Luggage was boring, a tool to accomplish a job.
Things started to change in the years from 2012 to 2020, as a few startup brands began shaking things up in luggage. Away, founded in 2015, made a big splash with a new line of suitcases designed to be stylish and exciting, a very prominent social media presence, and a series of well-placed celebrity endorsements.
More new startups followed suit, and while each took a slightly different approach, they all shared a few important principles: attention to style, a focus on travel experiences rather than just functional products, strong internet marketing, and direct-to-consumer models that dispensed with the need for contracts with big retailer stores.
The landscape of the luggage industry looks very different now. While the old players like Samsonite, American Tourister, and Travelpro are still there, several of the newer brands have gained a serious foothold in the market.
Top Luggage Brands by Search Volume
One way to compare the top luggage brands is by internet search volume. While this isn’t a perfect metric for revenue or number of suitcases sold, it is an accurate way to gauge the interest and brand awareness of a particular brand.
I did an in-depth Google search analysis to find the brands with the highest search volume on Google. Because some brand names are common words (Away), and many brands sell more than just luggage, I analyzed search terms that included the word “luggage” (for example: “Away Luggage” and “Samsonite Luggage”).
The table below shows the top 20 luggage brands rated by monthly Google search volume according to Similarweb.
|
Top Luggage Brands by Search Volume |
||
| Brand | Monthly Search Volume | |
| 1 | Away |
159,000 |
|
2 |
Samsonite | 89,000 |
|
3 |
Beis |
84,000 |
| 4 | Monos |
43,000 |
|
5 |
Tumi | 34,000 |
| 6 | RIMOWA |
32,000 |
|
7 |
Delsey | 30,000 |
| 8 | Travelpro |
29,000 |
|
9 |
CALPAK | 25,000 |
| 10 | American Tourister |
23,000 |
|
11 |
Solgaard | 22,000 |
| 12 | Louis Vuitton |
12,000 |
|
13 |
Level8 | 7,600 |
|
14 |
July |
7,500 |
| 15 | Briggs & Riley |
6,900 |
|
16 |
Bric’s | 6,000 |
| 17 | COOLIFE |
5,000 |
|
18 |
Paravel | 4,900 |
| 19 | Victorinox |
4,800 |
|
20 |
Eagle creek |
4,400 |
Away Luggage has the highest internet search volume by far. This brand has poured tremendous effort and resources into marketing and brand awareness, and that effort has clearly paid off.
Away’s revenue in 2022 was $231.8 million. Samsonite’s revenue reached $2.9 billion in the same year according to Samsonite’s Annual Results Announcement—over 10 times as much as Away.
These statistics highlight the fact that, while internet marketing and search volume are important, they aren’t the only way for a brand to be successful. Away’s internet and social media presence blows Samsonite out of the water, but Samsonite is dominant in sales because of its near-ubiquitous presence in retail stores around the world.
While new brands are starting to make a big impact on the luggage industry, Samsonite isn’t going anywhere soon.
Carry-On Luggage Statistics
Carry-on luggage is designed to fit in the overhead bin of an airplane. We analyzed the volume, weight, and price of the 96 carry-on suitcases currently in our luggage database.
Carry-On Luggage Volume
Carry-on luggage has to fit within very strict size limits, and most people look for luggage that is close to those limits so they can have the most packing space. The result is that the volumes of carry-on suitcases are very concentrated right around 40 L.
The average carry-on suitcase has 40.3 L of volume, and 68% of carry-ons are between 34.6 L and 46 L. Suitcases at the lower end of this range are compact, lightweight suitcases for international travel. Suitcases at the upper end of this range are designed to maximize space on domestic flights that have more generous size limits.
Many larger carry-on suitcases achieve higher volumes with zippered expansion. That means they can be compressed for trips with tighter airline size restrictions.
|
Carry-On Luggage Volume Statistics |
|
| Average |
40.3 L |
|
Median |
40 L |
| Standard Deviation |
5.7 L |
Carry-On Luggage Weight
Weight is an important factor for carry-on luggage. Lightweight carry-on luggage will be easier to lift into the overhead bin and easier to keep within airline weight restrictions.
The average weight for carry-on suitcases is 7.6 lbs, and 68% of carry-ons are between 6 lbs and 9.2 lbs. The lightest carry-on in our database is the July Carry-On Light. At 3.9 lbs, it is only slightly over half of the average weight.
|
Carry-On Luggage Weight Statistics |
|
| Average |
7.6 lb |
|
Median |
7.5 lb |
| Standard Deviation |
1.6 lb |
Carry-On Luggage Price
Price is an important metric when comparing rolling carry-on luggage. The carry-ons in our database cover a wide range of price ranges, from ultra-budget to ultra-luxury.
The average MSRP of the carry-ons we analyzed was $351.09. The median was significantly lower, at $299.99. This indicates that the data is right-skewed, meaning there is a much larger number of suitcases at the lower end of the range (under $300) and a few very high-priced items that bring up the average.
These outliers on the expensive end include suitcases from luxury brands like RIMOWA and Tumi. The most expensive carry-on in our database is the RIMOWA Original Cabin, which cost $1430.00 at the time of publication.
At the opposite end of the spectrum, there is a vast array of affordable carry-on luggage available for as low as $50 or less.
|
Carry-On Luggage Price Statistics |
|
| Average |
$351.09 |
|
Median |
$299.99 |
| Standard Deviation |
$271.52 |
Checked Luggage Statistics
Checked suitcases are designed to be checked into the cargo hold of a plane, and are much larger than carry-ons since they don’t have the same strict size limits. Checked bags are also often simpler in design and construction, without as many pockets and features.
Our analysis included both hardside luggage and softside luggage models that are marketed for check-in use.
Checked Luggage Volume
Checked suitcases range from slightly bigger than carry-on limits to massive bags that are suitable for family trips or moving internationally.
The average checked luggage volume is 91.2 L—more than double the average carry-on volume. 68% of checked suitcases are between 68.5 L and 113.9 L. The largest wheeled suitcase in our database is the Travelpro Platinum Elite 29” Spinner, which is 143.5 L when fully expanded.
|
Checked Luggage Volume Statistics |
|
| Average |
91.2 L |
|
Median |
90 L |
| Standard Deviation |
22.7 L |
Checked Luggage Weight
The average weight for checked suitcases is 10.4 lbs. This is only 36% more than the average for carry-ons, which is surprising since checked luggage is more than double the size on average.
The spinner wheels, frames, corner reinforcements, and telescoping handles account for a large portion of suitcase weight. These components don’t change much based on the luggage size: a massive checked suitcase still has the same four spinner wheels as a carry-on.
The only significant weight addition from carry-on to checked suitcase is the main shell materials, which are significantly lighter than the structural parts. This explains why the weight difference isn’t as large as you may expect.
|
Checked Luggage Weight Statistics |
|
| Average |
10.4 lb |
|
Median |
10.2 lb |
| Standard Deviation |
2.2 lb |
Checked Luggage Price
Because of the additional size and materials, checked luggage is significantly more expensive than carry-on luggage—around $54 more on average.
We see the same trend here as with the carry-ons: the median MSRP is significantly lower than the average, meaning a handful of very expensive suitcases are skewing the data. Our database has a huge price range for checked luggage, from under $100 to nearly $1400.
|
Checked Luggage Price Statistics |
|
| Average |
$405.51 |
|
Median |
$326.50 |
| Standard Deviation |
$271.52 |
Luggage Statistics by Region
Luggage use and interest are not uniform around the globe. Here are the most important regional luggage statistics.
Google Search Interest in Luggage by Country
Breaking down Google search volume for luggage by region is an interesting way to compare the interest in luggage between regions. This isn’t a perfect metric, but it shows how much people are searching for luggage online.
Using Google Trends, I ranked the countries with the highest and lowest search interest for the term “luggage” in 2023.
Google rates search interest as a proportion of all searches. The region with the highest search interest gets a score of 100, and every other region’s score is a percentage of that (a score of 50 means half the search interest of the highest score). I excluded regions with low search volume for this study; that leaves 52 regions to consider.
The table below shows the 10 regions with the highest search interest for the term “luggage” in 2023, according to Google Trends.
|
Highest Luggage Search Interest by Country |
||
| Country |
Search Interest |
|
|
1 |
Singapore | 100 |
| 2 | United Kingdom |
45 |
|
3 |
Australia | 45 |
| 4 | New Zealand |
37 |
|
5 |
Canada |
36 |
The table below shows the 5 countries with the lowest search interest for the term “luggage” in 2023, according to Google Trends.
|
Lowest Luggage Search Interest by Country |
||
| Country |
Search Interest |
|
|
1 |
Brazil | <1 |
| 2 | Russia |
1 |
|
3 |
Turkey | 1 |
| 4 | Mexico |
1 |
|
5 |
Poland |
1 |
Interestingly, the top four countries with the highest search interest in luggage are all island countries. Logically, this makes sense since air travel is a more common necessity for residents in smaller island countries.
This trend isn’t universal, however, as Japan and Indonesia are both island nations with very low Google search interest for luggage.
These countries with the highest interest are also very wealthy compared to the global population. In contrast, the countries with the lowest interest in luggage are mainland countries with significantly lower wealth levels.
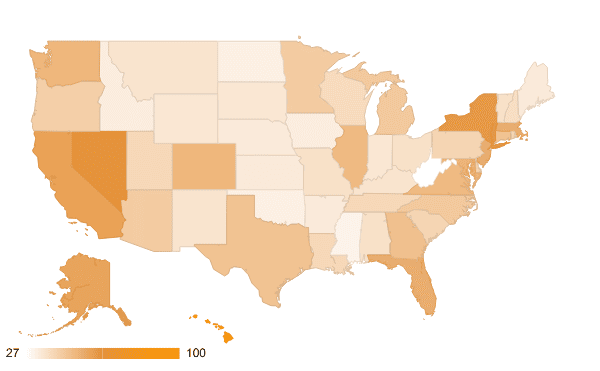
Google Search Interest in Luggage by State
There is also a significant difference in luggage search interest between states in the US. The graph and table below show the Google Trends search interest for all 50 states plus the District of Columbia.
|
Luggage Search Interest by State |
||
| State |
Search Interest |
|
|
1 |
Hawaii | 100 |
| 2 | Nevada |
63 |
|
3 |
District of Columbia | 62 |
| 4 | New York |
61 |
|
5 |
California | 58 |
| 6 | Alaska |
57 |
|
7 |
New Jersey | 54 |
| 8 | Florida |
54 |
|
9 |
Massachusetts | 54 |
| 10 | Maryland |
52 |
|
11 |
Colorado | 51 |
| 12 | Washington |
51 |
|
13 |
Virginia | 50 |
| 14 | Illinois |
50 |
|
15 |
Georgia | 48 |
| 16 | Texas |
47 |
|
17 |
Connecticut | 47 |
| 18 | North Carolina |
45 |
|
19 |
Michigan | 45 |
| 20 | Arizona |
44 |
|
21 |
Minnesota | 44 |
| 22 | Oregon |
43 |
|
23 |
Delaware | 42 |
| 24 | Pennsylvania |
41 |
|
25 |
South Carolina | 41 |
| 26 | Rhode Island |
41 |
|
27 |
Louisiana | 40 |
| 28 | Utah |
40 |
|
29 |
Tennessee | 40 |
| 30 | Wisconsin |
39 |
|
31 |
New Hampshire | 38 |
| 32 | Missouri |
37 |
|
33 |
Alabama | 37 |
| 34 | Vermont |
37 |
|
35 |
Ohio | 37 |
| 36 | Montana |
36 |
|
37 |
New Mexico | 36 |
| 38 | Kentucky |
36 |
|
39 |
Wyoming | 35 |
| 40 | Indiana |
35 |
|
41 |
South Dakota | 35 |
| 42 | Arkansas |
34 |
|
43 |
Maine | 34 |
| 44 | Nebraska |
34 |
|
45 |
Kansas | 34 |
| 46 | Iowa |
33 |
|
47 |
Idaho | 33 |
| 48 | North Dakota |
32 |
|
49 |
Oklahoma | 32 |
| 50 | Mississippi |
31 |
| 51 | West Virginia |
27 |
The state with by far the highest search interest in luggage is Hawaii. This matches the international trend of island countries having higher interest in luggage—because air travel is a more regular necessity. Alaska also has high interest in luggage for similar reasons.
Other states with high interest in luggage include Nevada, Washington DC, New York, and California. These states all have large urban centers, where people are more likely to travel.
The states with the lowest interest in luggage are much more rural. These include West Virginia, Mississippi, Oklahoma, North Dakota, and Idaho. Looking at the map, you can see that search interest in luggage is highly concentrated on the coasts and lowest in the middle of the country.
There is existing research indicating that urban dwellers travel more than people living in rural areas. It is interesting to see that same trend reflected in the luggage industry.
Sources and Methodology
The data used in this report is divided into three categories: market data, search data, and product data.
The market data includes annual sales, global market size, and market growth forecasts. I collected this data from several trusted market research, including Statista, Grand View Research, Similarweb, and Mordor Intelligence. I combined these individual data points and sets to get a more complete picture of the global luggage market.
Search data was collected using Google Trends. I used this tool to collect Google search statistics for the 2023 calendar year. I analyzed search results for the search term “luggage” and segmented out searches by country, state, and month. These search results serve as a proxy for public interest in luggage, and are useful for measuring trends geographically or over time.
To collect product data, I used TravelFreak’s luggage rating database, which stores the metrics we use for reviewing and scoring luggage. We store 37 distinct data points for every suitcase in our database, which gives a wealth of information to draw from. The details in our product database come from decades of in-depth research and testing, and contains details on 196 suitcases.
I used this data to extract averages and statistical distributions for weight, volume, MSRP, and materials used across the different luggage categories.
Changelog
We periodically review this report, check for errors or inconsistencies, and update it with the most recent data. Here is the change history for this report.
- February 26, 2024—first published
About the Author
Jakob Thygerson
Jakob Thygerson is an outdoor adventure seeker who collects sunburns, National Park maps, and trail miles. He loves anything that gets him outdoors, whether it’s on foot, on skis, on a bike, or on the open road. A native of the Mountain West, he’s most at home in mountains and deserts with clear air and bright stars.
He has a background in product design engineer and knows the ins and outs of materials, design, and manufacturing processes. He loves using this knowledge to analyze outdoor equipment and is an unrepentant gearhead.